Meal Comparison, Part 3: Dinner

Today’s post will be the last side-by-side comparison of a Standard American Diet (S.A.D.) meal and a grain-free, unprocessed meal.

For Part 1, a breakfast comparison, click here. For Part 2, a lunch comparison, click here.

The healthy American dinner consists of:
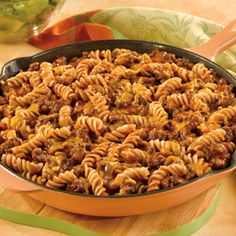
Pasta1 cup whole wheat pasta (enriched)

1 cup generic tomato sauce

2 ounces low-fat ground turkey

1 cup skim milk (fortified & fortified)

1 brownie (using a recipe recommended by Ellie Kroger, Registered Dietician)

The whole foods meal contains:

Burgers

8 ounces ground beef (grass-fed)

½ avocado

1 cup asparagus

1 large sweet potato

Both meals provide 650 calories.

First, let’s look at the macronutrients and fatty acid profile:

. Total Carbs Fiber Net Carbs Protein Sat Fat Mono Fat Omega 3 Omega 6
S.A.D. Dinner 90 10 80 25 5 5 250 12500
Whole Foods 45 15 30 45 10 17 500 2000

As we saw in the previous comparisons, the S.A.D. meal provides almost 100 grams of carbs with only 10 grams of fiber and very little healthy fat. Even adding sweet potato to the grain-free dinner results in only 30 net carbs, fewer than half the carbs in the Standard American dinner.

The whole foods dinner offers a more adequate amount of healthy fat, particularly saturated and monounsaturated, aiding in absorption of vitamins, providing a stable energy source, and maintaining healthy cells.

Finally, the omega-3 to omega-6 ratio, which should ideally be close to 1-to-2, is 1-to-50 in the Standard American Diet meal. The tomato sauce and “healthy” brownie both contain canola oil, molecularly the same as corn oil, causing inflammation and cardiovascular disease.

Next is the vitamin content of both meals:

. Vit A Vit C Vit D Vit E Vit K Vit B6 Vit B12 Folate
S.A.D. Dinner 4500 20 0 3 30 0.5 1 50
Whole Foods 27000 42 0 7 83 2 5 180

No surprise here! Vegetables, meats, and healthy fats provide far more vitamins than refined grains, diary, and oils.

Finally, the mineral content of each meal:

. Calcium Iron Magnesium Potassium Zinc Copper Manganese Selenium
S.A.D. Dinner 570 5 150 1500 4 0.5 2 55
Whole Foods 130 10 150 2000 13 1 1 36

If you recall the previous comparisons, you’ll remember that grains and dairy provide more of certain nutrients.

The Standard American Diet provides more Manganese and Selenium, and ties for Magnesium. However, just a handful of nuts would close this gap and set the whole foods meal ahead in all categories.

In conclusion, the dinner based on whole foods provides more for the body, with less detriment, than the S.A.D. dinner.

I will do one more follow up post totaling the days’ worth of macro- and micro-nutrients. In the meantime, feel free to ask any questions about particular values, foods that may address shortcomings, or if you’d like me to analyze your own meal options.

Thanks for reading!

The Most Nutritious Foods

As many of you know by now, I try to consume the most nutritious foods possible. However, I’ve never listed exactly what foods provide the most nutrients per serving.

Advertisements claim that certain foods are important nutritionally. Markets assign numbered scores to various products. Most of these rating systems, such as NuVal and ANDI, are inaccurate for a number of reasons.

First, they look at nutrients that are not essential for life, and conversely, overlook nutrients that are necessary for life. Second, they draw from disproved nutritional norms, such as dietary cholesterol and saturated fat being “bad”. Thirdly, they are designed by agricultural companies or individuals with a bias.

Scientists, such as Loren Cordain and Mat Lalonde, have done extensive work in the last few decades to redesign nutrient rating systems. They set aside non-essential nutrients in food and focused purely on what the body must consume from outside sources.

The body cannot produce the following:

Fatty Acids: Omega 3 and Omega 6

Amino Acids: isoleucine; leucine; lysine; methionine; phenylalanine; threonine; tryptophan; valine; histidine

Vitamins: A; Bp (choline); B1 (thiamine); B2 (riboflavin); B3 (niacin); B5 (pantothenic acid); B6; B7 (biotin); B9 (folic acid); B12; C; D; E; K

Minerals: calcium; chloride; chromium; cobalt; copper; iodide; iron; magnesium; manganese; molybdenum; nickel; phosphorus; potassium; selenium; sodium; sulfur; zinc

These nutrients were plugged into the following formula to determine nutrient density:

(sum of essential nutrients per serving) ÷ (weight per serving)

I’d like to make a few points before posting Mat’s nutrient density list.

First, the database he drew from did not have complete data for certain nutrients.

The database did not differentiate between preformed vitamins and their final form. Vitamin A, “beta-carotene”, in sweet potatoes and carrots, must be converted to “retinol”, found in egg yolks and liver. Vitamin K1, found in green leafy vegetables, requires conversion to K2, found in grass-fed dairy.

There was no way to account for bioavailability of nutrients. Most grains, legumes, nuts, and seeds contain high levels of phytates which prevent absorption of nutrients and minerals.

Finally, and most importantly, the diet, age, and lifestyle of animals were not specified. Grass-fed beef, raised on open pastures, is much healthier than corn-fed beef, raised in stalls that restrict movement. Also, mature ducks having more nutritional value than baby ducks.

Taking this unavailable data into consideration, we can assume that most animal products would move up a few spots. This is because most plants have limited amino acids and fatty acids, and the vitamins found in vegetables must be converted or activated.

Without further ado, the ranking of nutrient density averages for the food groups:

1.) Organ Meats and Oils
2.) Herbs and Spices
3.) Nuts and Seeds
4.) Cacao
5.) Fish and Seafood
6.) Pork
7.) Beef
8.) Eggs & Dairy
9.) Vegetables (raw & unprepared)
10.) Lamb, Veal, and Wild Game
11.) Poultry
12.) Legumes
13.) Processed Meat
14.) Vegetables (cooked, canned, blanched, pickled)
15.) Plant Fats and Oils
16.) Fruit
17.) Animal Skin and Feet
18.) Grains and Pseudocereals (cooked)
19.) Refined and Processed Fats and Oils
20.) Grains (canned)
21.) Processed Fruit

Many people will be surprised by how low grains appear on the list. The nutrient value of raw grains would place them in the top 5. However, our bodies cannot digest raw grains. Taking nutrient loss during cooking and expansion of grains (1/4 cup raw rice = 1 cup cooked rice) into account, their value decreases dramatically.

I was quite surprised to see herbs, spices, and cacao near the top of the list. I always considered these foods to be enjoyable additions to a healthy diet, but not the most valuable sources of nutrients.

Two final notes regarding this list:

It is not a requirement to eat the most nutritious foods all the time. Certain nutrients, such as activated vitamin A (retinol) and selenium (abundant in Brazil nuts) are actually toxic in high doses.

Second, as previously mentioned, this rating system only looks at essential nutrients. Many vegetables contain antioxidants and fiber that can improve health, even though they are non-essential for life.

I would recommend consuming foods higher on this list and keeping your meals full of vegetables.
For Mat Lalonde’s complete presentation, follow this link to YouTube.

Matheiu Lalonde has a PhD in Organic Chemistry and a postdoctoral degree in Inorganic Chemistry from Harvard. He teaches, lectures, and is the Science Safety Officer at Harvard’s Department of Chemistry and Chemical Biology. I have to give him credit for the motivation behind, and information in, this post.

I hope this sets aside all confusion of what is best to eat.

Keep in mind that human-run studies can be flawed, correlations from epidemiological studies can be weak, and research can be conducted to prove a point, rather than discover the truth, but the actual make-up of foods cannot be disputed!